

Stress error estimates are commonly used in finite element analysis to indicate how stress varies within and between elements. These estimates do not determine whether results are correct or incorrect, but they can help identify regions where stress gradients are large and where increased mesh density may be considered.
Many FEA tools provide stress error estimates as part of their tabular output, reporting the highest estimated value on a per-region basis. With the December 2025 release of Paulin Research Group software, this information can be generated through the Stress Error Estimate Report.
Stress Error Estimate Reporting
In finite element analysis, stress results from shell-element models are often organized into regions to support stress evaluation and reporting. Stress error estimates are similarly summarized on a regional basis to help identify areas where stress variation within elements is highest.
In PRG software, the Stress Error Estimate Report displays the maximum stress error estimate for each region in the model. This report is not printed by default; the corresponding checkbox in the ASME/EN Panel within each program must be selected to include it in the tabular output.

The image below shows a NozzlePRO model with the default mesh density for a cylinder-on-cylinder intersection. The meshing algorithm will place more elements near the discontinuity, i.e. the critical regions, where the highest stress is expected.

Below is a sample report after analyzing the model.

How Stress Error Estimates Are Calculated
The error estimate is calculated using the following method. There is no rule of thumb for a particular acceptable stress estimate percentage. The user must look at the stress output and the error estimate results and determine whether the mesh density is acceptable for the particular model.

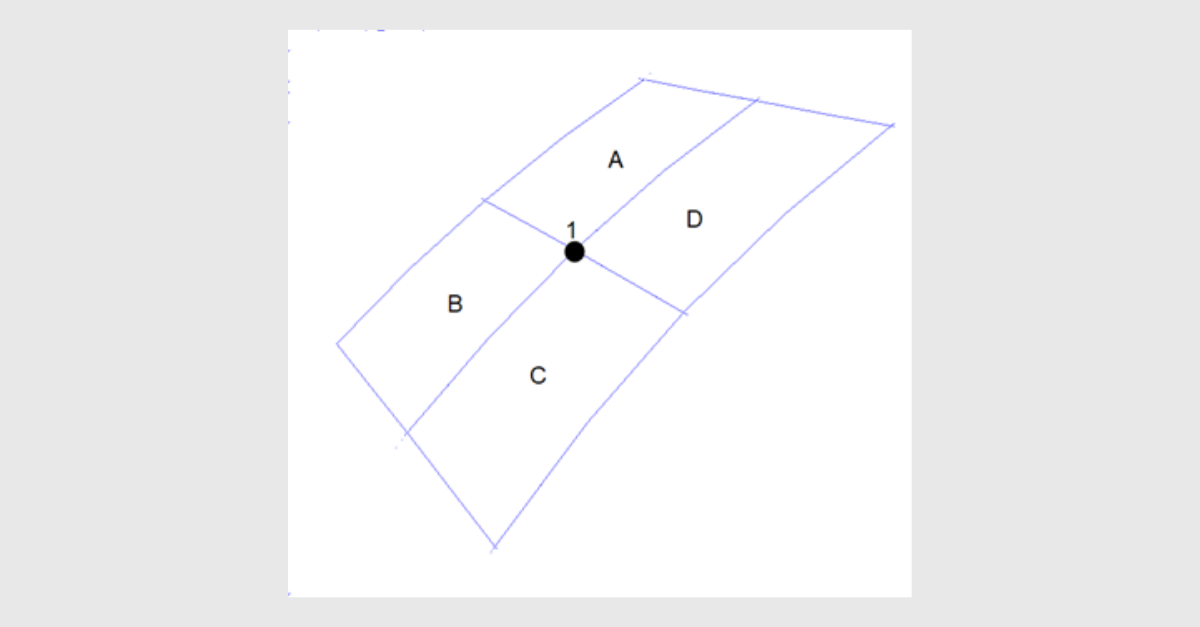
At node 1, four elements are connected to the node. Assume the effective stress at node 1 from each element can be denoted as A1, B1, C1, D1, the averaged effective stress at node 1 can be calculated as
E = (A1 + B1 + C1 + D1)/4
Then the maximum difference between E and other four values is
Dmax = max(E - A1, E - B1, E - C1, E - D1)
The error estimate at node 1 can be obtained
Rel = Dmax/E * 100%
Interpretation of the Error Estimate
As shown by the calculation, the stress error estimate can be large when the difference between the averaged nodal stress and the individual element stresses is significant. This commonly occurs when there is a large stress gradient within an element, which is expected in regions near geometric discontinuities.
A high stress error estimate does not necessarily indicate that the stress results are inaccurate. The estimate provides an indication of stress variation within the element and can be used to determine whether additional mesh refinement may be appropriate.
There is no specific rule of thumb for an acceptable stress error estimate percentage. The error estimate should be reviewed alongside stress contours and with consideration of the expected behavior of the geometry.
Additional Information in the Report
The Stress Error Estimate Report includes additional information to support interpretation:
Surface Location
The surface location shows, for shell elements, where the highest error estimate is located. It can be at the outside or inside surface of the geometry. Stresses are extrapolated to the inside and outside surfaces within the software to properly capture the bending stress at the inside and outside surfaces.
Load Case
This identifies the load case in which the highest stress error estimate occurs. The load case number and description can be found in the Load Case Report.
Node Number and Element Number
This is the node number in which the highest error was found. The same node number can belong to more than a single element, therefore, the element number is also displayed in the table. In this way, the user can find the element number and node to find the largest error estimate if needed.
Interpretation of Results
The results below, using the default mesh density, show a smooth transition of stress from element to element, indicating that the mesh density used in this model is adequate for this geometry. Different geometries have different requirements for mesh density in different regions. PRG software, being template-based, knows the geometry expected and can properly determine where to locate more elements.

Conclusion
Stress error estimates provide a structured way to evaluate stress variation within a finite element model and to identify regions where mesh refinement may be considered. When reviewed in conjunction with stress results and engineering judgment, they support appropriate mesh selection for design-by-analysis evaluations.
PRG software incorporates stress error estimation into its standard analysis workflow, allowing engineers to review mesh behavior directly from the tabular output.
To apply these concepts in practice, engineers can use NozzlePRO and other Paulin Research Group analysis tools, which incorporate mesh quality and stress error reporting into code-aligned design-by-analysis workflows for pressure equipment.
Book a consultation with our experts to discover how PRG software can meet your FEA needs.
